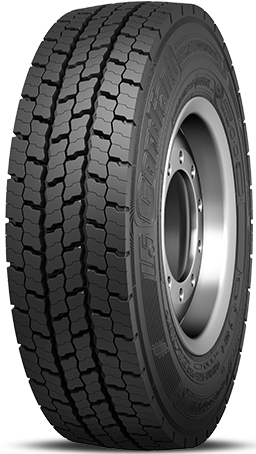
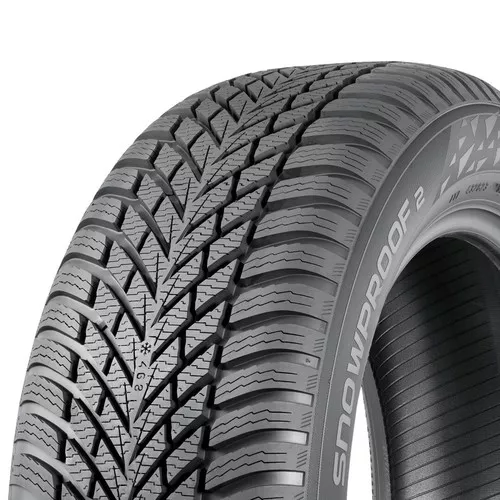
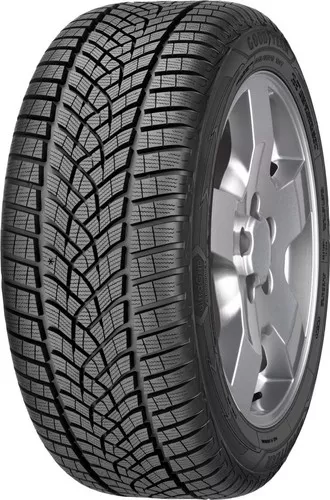
Comparison: Pneumant Summer ST2 vs. Nokian Snowproof 2 vs. GoodYear UltraGrip Performance+
Also compare with


 Pneumant Summer ST2Nokian Snowproof 2GoodYear UltraGrip Performance+Pneumant Summer ST2Nokian Snowproof 2GoodYear UltraGrip Performance+Pneumant Summer ST2Nokian Snowproof 2GoodYear UltraGrip Performance+Pneumant Summer ST2Nokian Snowproof 2GoodYear UltraGrip Performance+Pneumant Summer ST2Nokian Snowproof 2GoodYear UltraGrip Performance+Pneumant Summer ST2Nokian Snowproof 2GoodYear UltraGrip Performance+Pneumant Summer ST2Nokian Snowproof 2GoodYear UltraGrip Performance+Pneumant Summer ST2Nokian Snowproof 2GoodYear UltraGrip Performance+Pneumant Summer ST2Nokian Snowproof 2GoodYear UltraGrip Performance+Pneumant Summer ST2Nokian Snowproof 2GoodYear UltraGrip Performance+Pneumant Summer ST2Nokian Snowproof 2GoodYear UltraGrip Performance+Pneumant Summer ST2Nokian Snowproof 2GoodYear UltraGrip Performance+
Compare prices across all available dimensions for these tyres.