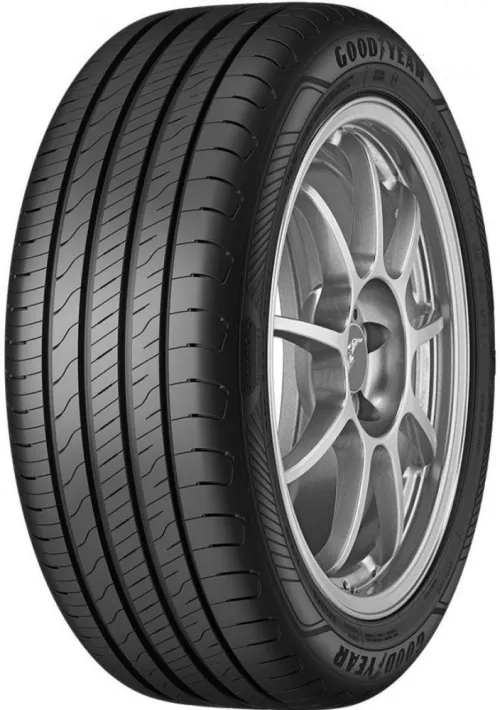
Comparison: Pneumant Summer ST2 vs. GoodYear Efficientgrip Performance 2
Also compare with

 Pneumant Summer ST2GoodYear Efficientgrip Performance 2Pneumant Summer ST2GoodYear Efficientgrip Performance 2Pneumant Summer ST2GoodYear Efficientgrip Performance 2Pneumant Summer ST2GoodYear Efficientgrip Performance 2Pneumant Summer ST2GoodYear Efficientgrip Performance 2Pneumant Summer ST2GoodYear Efficientgrip Performance 2Pneumant Summer ST2GoodYear Efficientgrip Performance 2Pneumant Summer ST2GoodYear Efficientgrip Performance 2Pneumant Summer ST2GoodYear Efficientgrip Performance 2Pneumant Summer ST2GoodYear Efficientgrip Performance 2Pneumant Summer ST2GoodYear Efficientgrip Performance 2Pneumant Summer ST2GoodYear Efficientgrip Performance 2Pneumant Summer ST2GoodYear Efficientgrip Performance 2Pneumant Summer ST2GoodYear Efficientgrip Performance 2
Compare prices across all available dimensions for these tyres.